I admit it: I am a numbers geek. I just love to track my portfolio and even though I have now started to correct my mistakes of the past and to follow an index investing strategy I am still addicted to see how the markets are moving and how much my portfolio is worth at the moment.
What are the best free tools to track your portfolio online?
While I have a rather sophisticated Excel sheet to track my finances this method requires lots of input and manual updating of data and therefore is not efficient. Thus I looked far and wide for some good tools to track my portfolio.
These are my requirements:
The tool should be:
- Free
- Able to track international stocks as well as exchange traded funds (ETFs)
- Calculate the exact performance of my portfolio
- Provide me with macro-economic news
- Ideally create nice graphs, because as you can tell from this blog, I am rather fond of graphs!
- Track the performance in multiple currencies
After sifting through countless online tools and websites, I have found these four final contenders which I would like to review in detail.
I made a lot of trades this month which I will describe in the next monthly update. This is why the portfolio in the screen shots is newer than the one linked on this site.
Financial Times Portfolio Tool
Website: http://portfolio.ft.com/
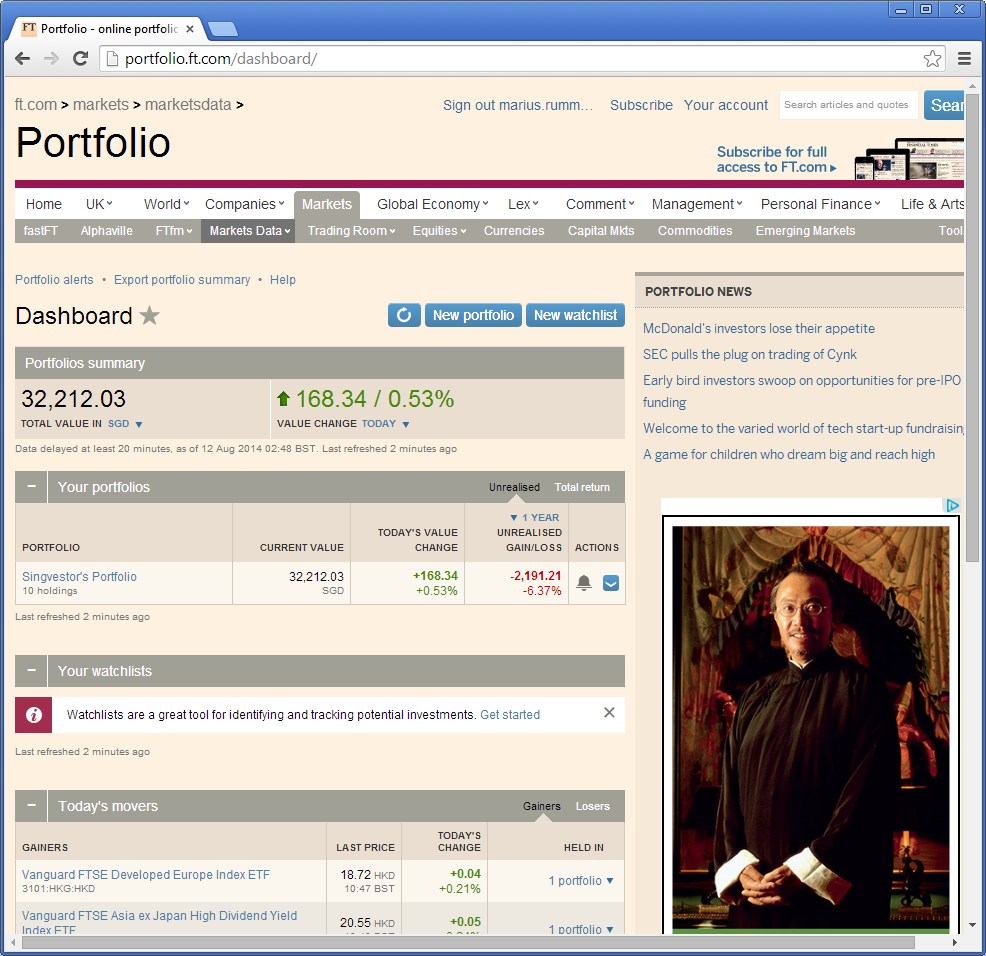
When you open the tool you are greeted by your dashboard which shows all your portfolios and relevant news. I only keep one portfolio, note the shameful performance due to all my silly stock picking before I became aware of low cost index investing:
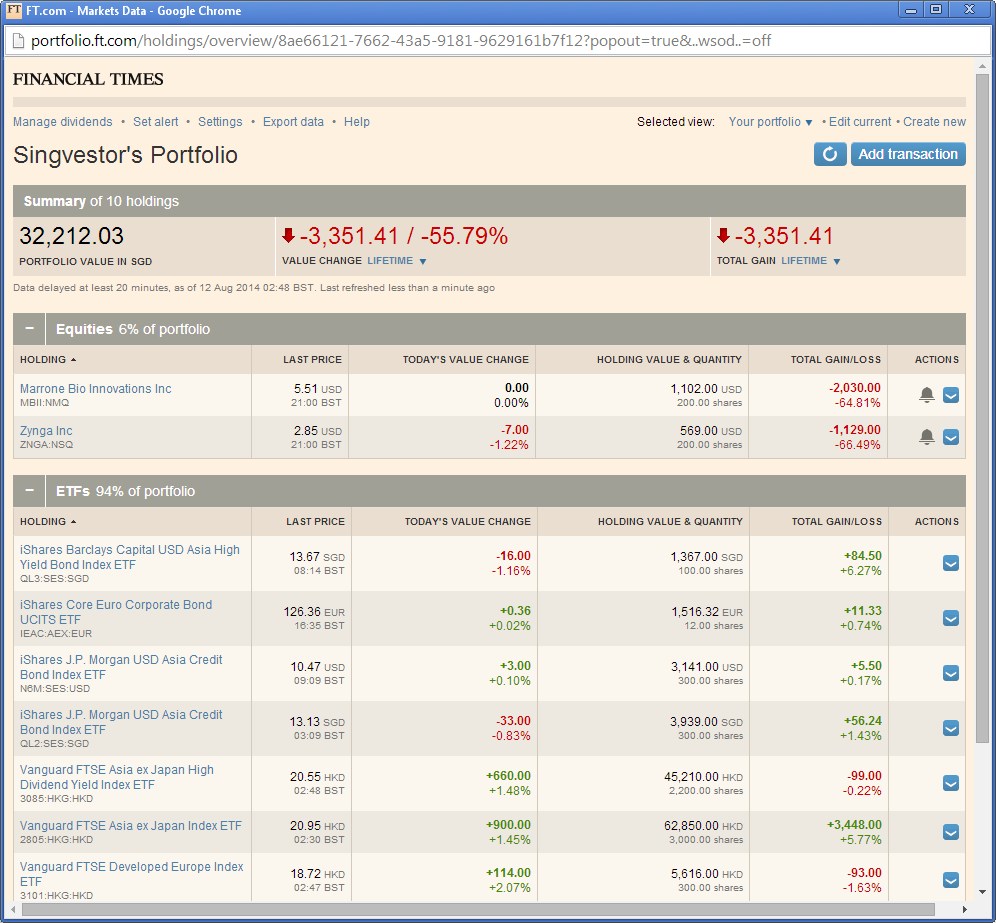
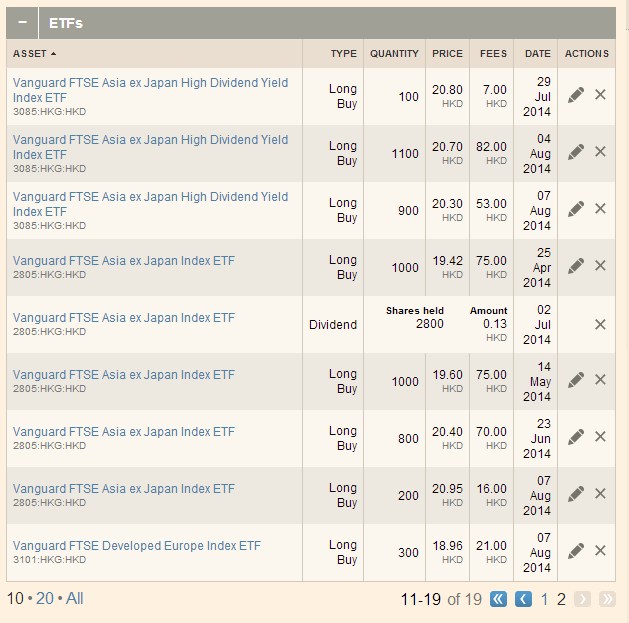
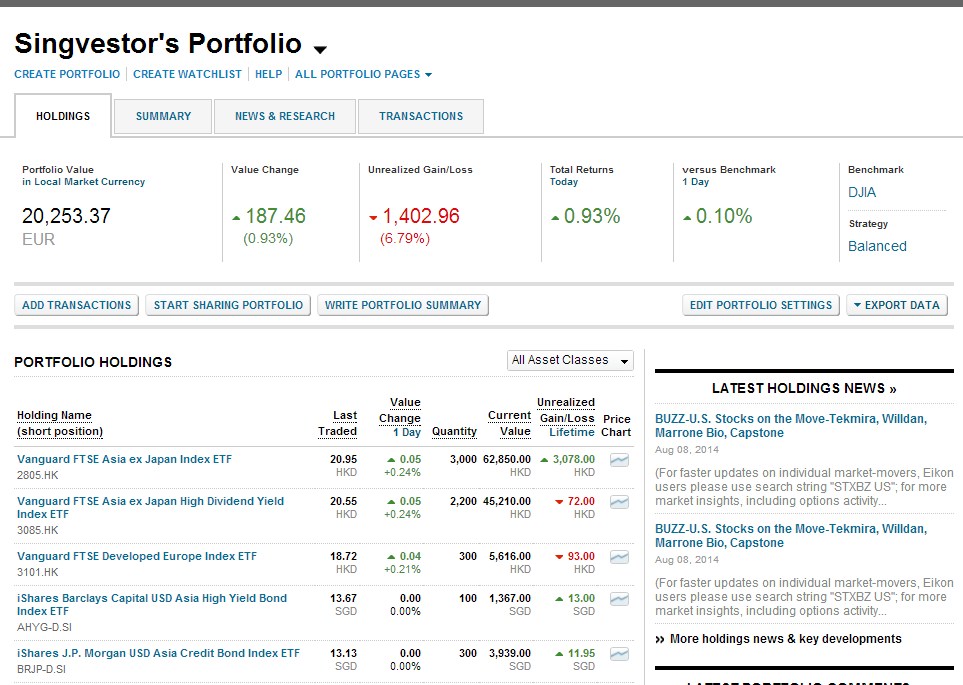
One more click takes us to my portfolio:
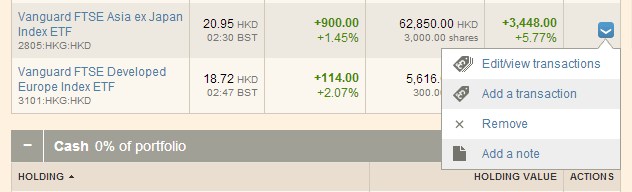
Next to each position you can pull up an options menu to view all your transactions and notes:
The portfolio also allows you to hold cash accounts and can automatically credit dividends to these accounts, nice!
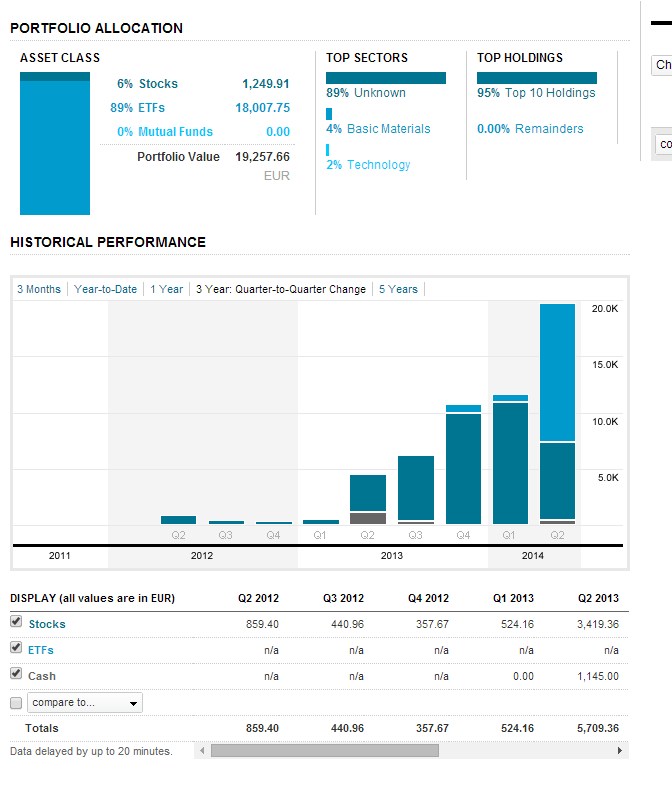
A click on “charting” brings up some rather nifty charts regarding my portfolio:
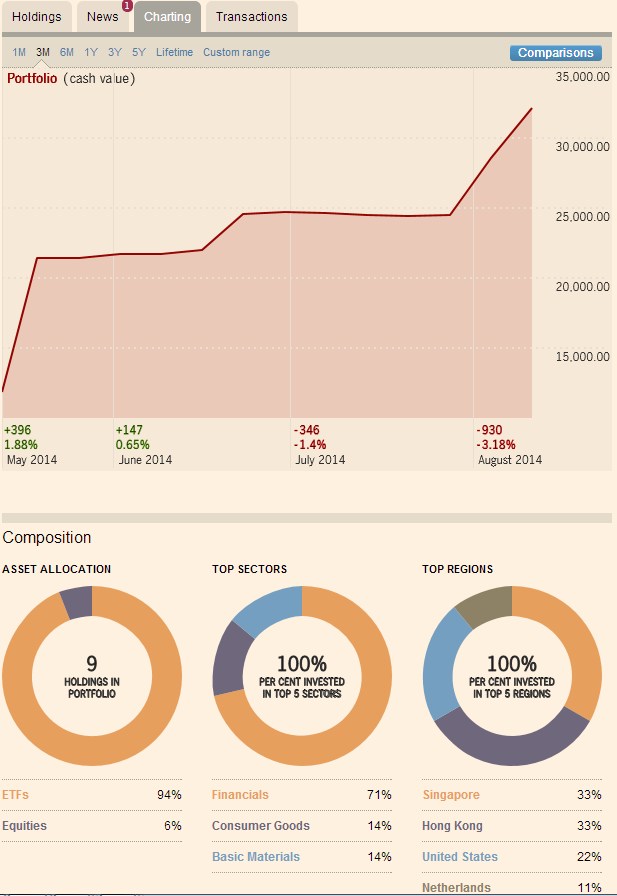
Unfortunately there are some draw backs, most importantly setting a custom range for the chart or only seeing the last month of data does not work.
The asset allocation graphs are quite limited when dealing with ETFs and data there is rather useless for my purpose. Still it may be a nice feature for some.
The “Transactions” page is one of the best parts of the tool and it does a good job noting all the transactions.
Verdict: Overall a very solid tool that is pleasant to use. If anything then the graphs should be improved which do not fully work in Google Chrome.
Recommended!
Google Finance
Website: http://finance.google.com
Is it 1998? Google Finance is a dinosaur, but not necessarily in a good way. Stuck in beta since years it has not received the tender loving care from the Google programmers which it would deserve. But let’s give it a chance:
The starting page shows a rather simple overview of the portfolio:
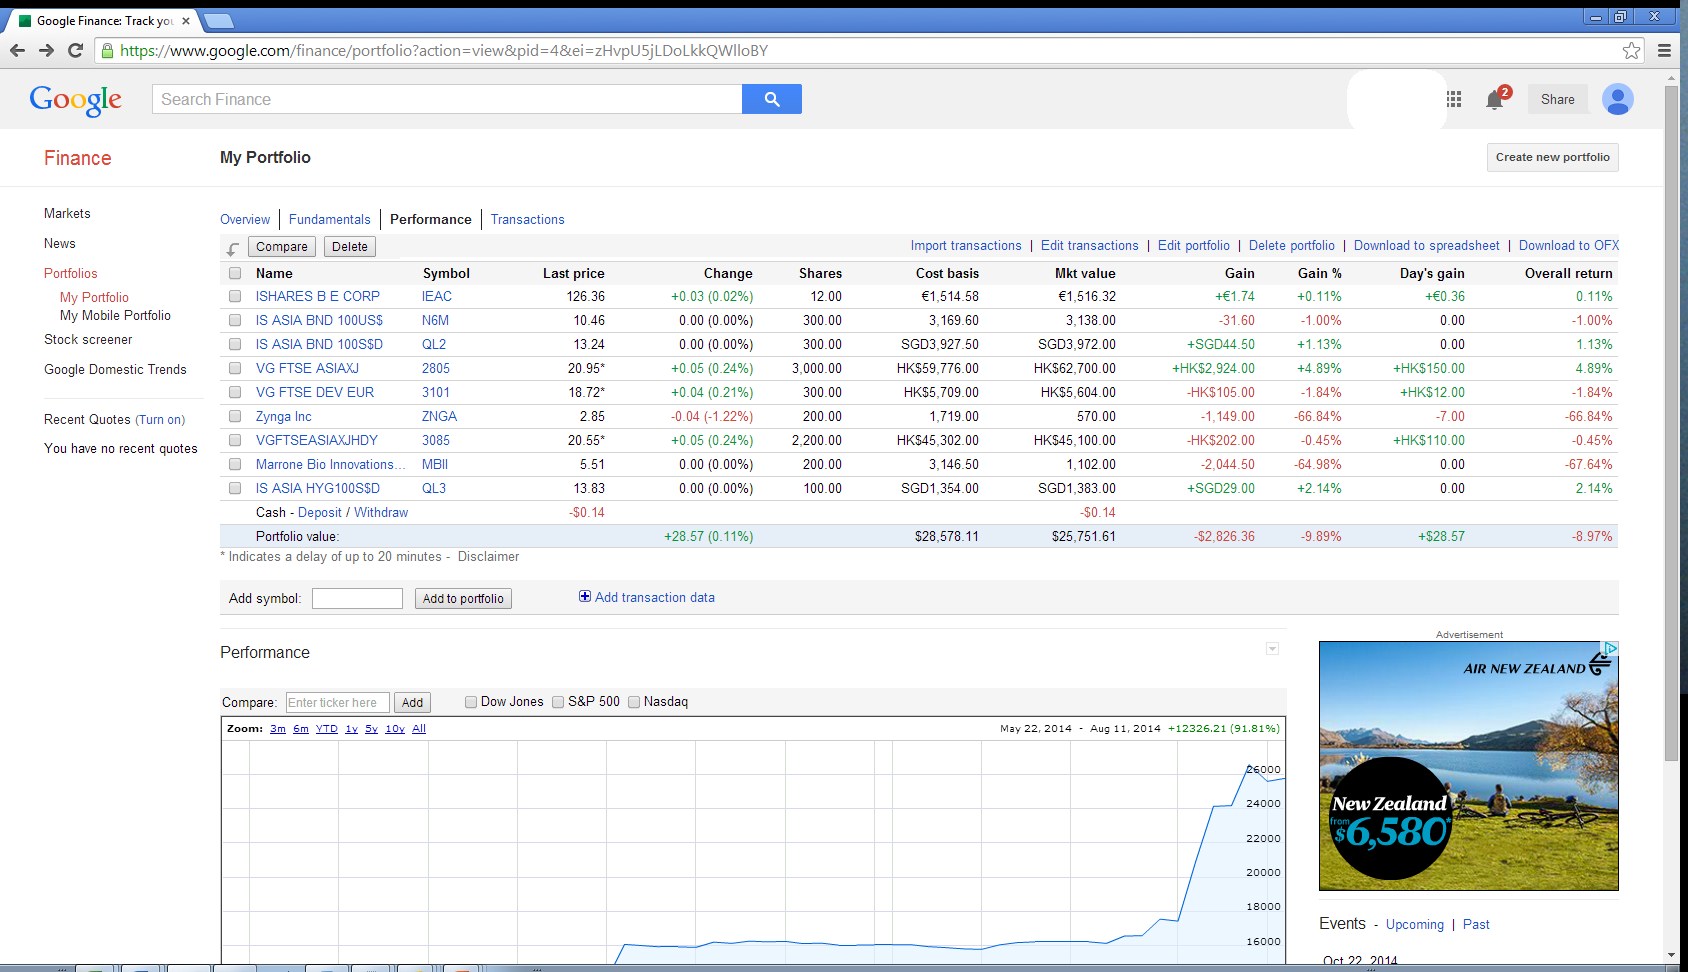
Unfortunately it is all in USD and there is no way to switch the view to SGD or any other international currency.
It presents a simple graph and basic figures for each position but that is about all. Entering ETFs into the portfolio is a pain, since Google does not find the stock when entering the full names or Bloomberg/Reuters codes. It relies instead on the stock exchange tickers which I needed to look up again.
Last but not least there is a data protection concern. My private e-mail and photo albums are with Google, I have a Google Plus profile (no idea why) and I use the search engine every day. Now that I entered my portfolio Google knows one more thing about me and while I believe Google’s famous motto “don’t be evil” it still makes me uneasy to throw all my data to the Kraken.
Verdict: Not recommended at the time as functionality is too basic, data entry is a pain and multiple currencies are not fully supported.
Bloomberg Portfolio Tool
Website: http://www.bloomberg.com/markets/watchlist
Bloomberg offers a nice portfolio tool. While it is modestly named “watchlist” it can do a whole lot more.
Tracking multiple portfolios and various currencies? No problem! Charts: Check. Relevant news: check.
Let’s have a deeper look into the portfolio tool:
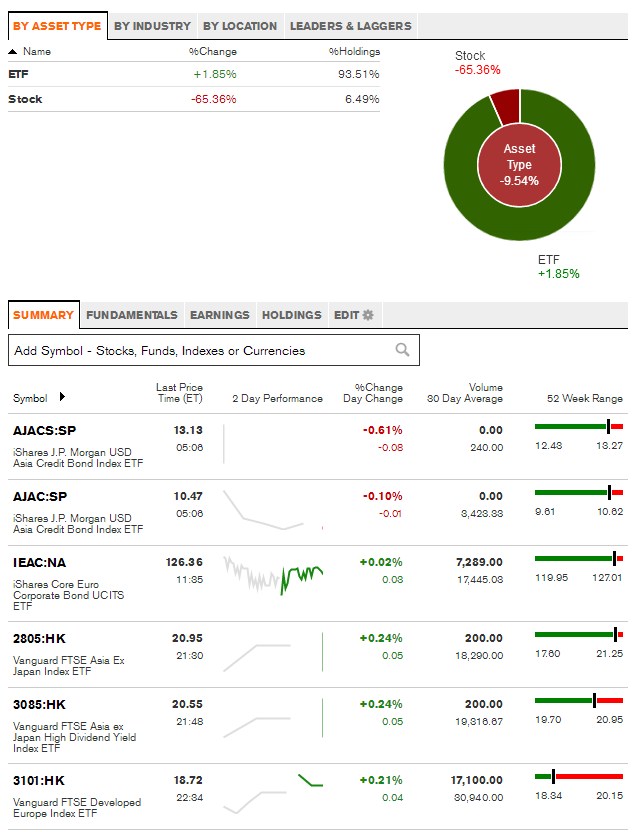
The summary page nicely shows the overview of all positions and shows their recent development and how they are currently priced with regards to their yearly high and low.
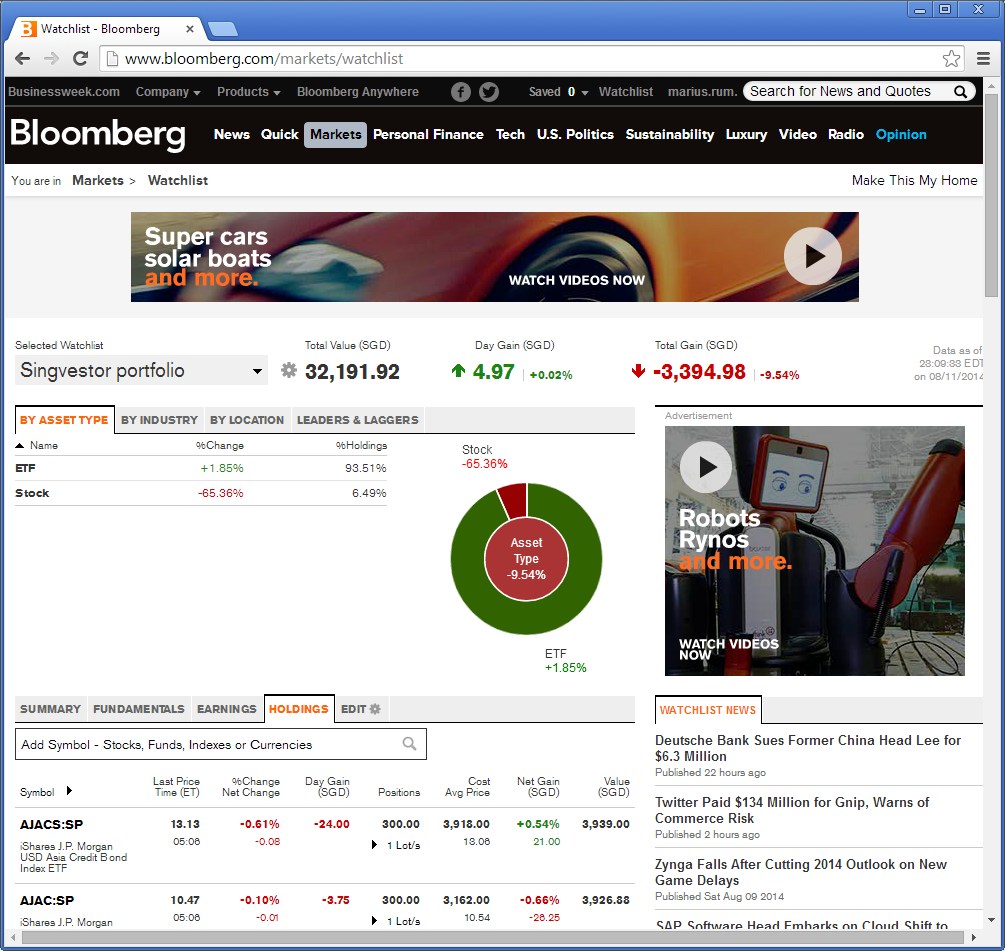
Under “holdings” we can see the current performance of all stocks and ETFs inside the portfolio. All lots are grouped nicely together and the performance and average price can be seen at the glance:
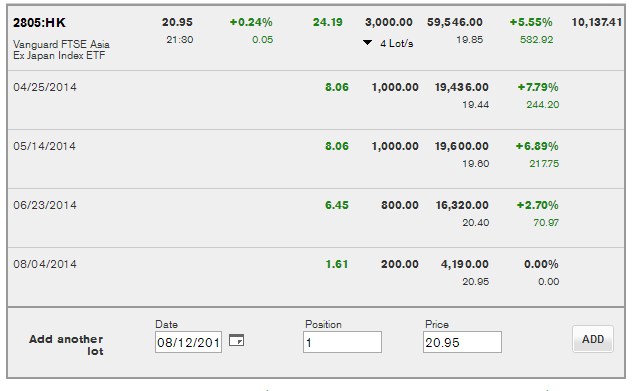
Not bad!
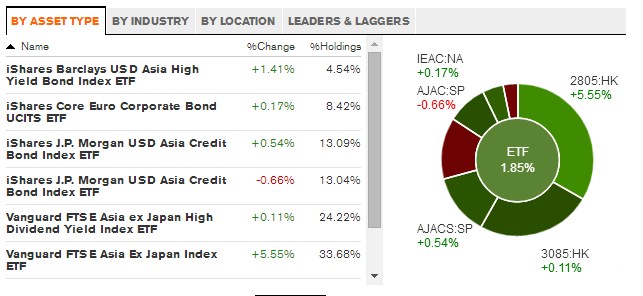
Another rather pleasant feature is the pie chart on top, which shows the composition as well as the performance of the portfolio.
You can then drill down and see the details:
Overall Bloomberg offers a really good tracking tool with a wide range of options and a pleasant, modern interface with nice charts. Recommended!
Reuters Portfolio tool
With Reuters being one of the best news agencies in the world I have rather high expectations for their portfolio tool. Let’s get right into it:
Reuters gives a quite tidy overview of the portfolio:
Unfortunately the portfolio can only be tracked in “large” currencies like USD and EUR and there is no way to track the portfolio in SGD. This is a big drawback for me.
However there are some nice charts to show the historic development of the portfolio allocation.
Unfortunately Reuters cannot analyze the ETFs in detail and the so the information is of limited use:
Still always nice to have at least basic charts.
The verdict: which tool is the best?
Hard to say! Looking at the features again this is a rough overview:
| Bloomberg | Financial Times | Google Finance | Reuters | |
| Ease of use | Good | Good | Terrible | Good |
| Graphs | Nice graphs | Nice graphs but some bugs | Rudimentary | Nice graphs |
| Multiple currencies | Yes | Yes | All in USD | Yes, but not SGD |
| Advantages | Nice interface, news integration | High quality news, several options to handle dividends | – | High quality news integrated |
| Disadvantages | – | – | Clunky data entry, bad graphs | No Singapore dollar tracking |
| Very subjective rating | 8/10 | 8/10 | 4/10 | 7/10 |
Conclusion
It is a very tight race between the great portfolio tracking tools from Bloomberg and the Financial Times. Both come with great graphs and the Financial Times portfolio can even track dividends received and include them in the calculation. At the end of the day both websites do a great job and you can go with either one.
Google Finance is absolutely hopeless and would need a major overhaul and Reuters needs to step up its game updating its tool which is starting to look slightly dated.
Hope this will help you! If you have any other online portfolio tools you would like to recommend please post them in the comments!
Hi Singvestor,
Thank you for introducing and reviewing those tools and I get to try out FT portfolio tool. It looks great online; however, I want to check with you whether you’ve any app/tool on mobile handset? It would be great if it can be viewed on mobile phones. Thanks.
Hi Z! The FT Portfolio tool works great via mobile browser as well since they have a rather nice scale-able website. I can also recommend Bloomberg’s free apps for portfolio tracking, but I am currently only using it on my ancient blackberry. Whatever you do, don’t install the Android version of Google Finance – not very useful in my opinion. If you find any good app just let me know!