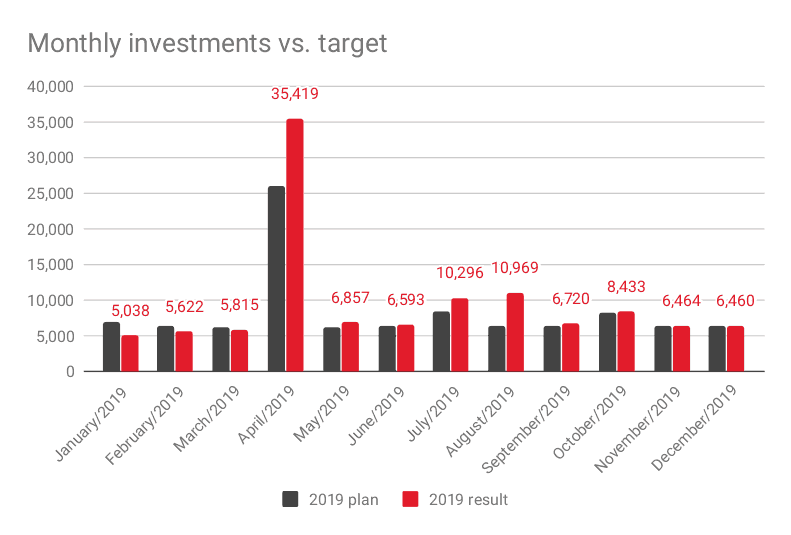
2019 I had planned to invest SGD 100,000 and I managed to exceed the goal. Read on for the details!
Portfolio update
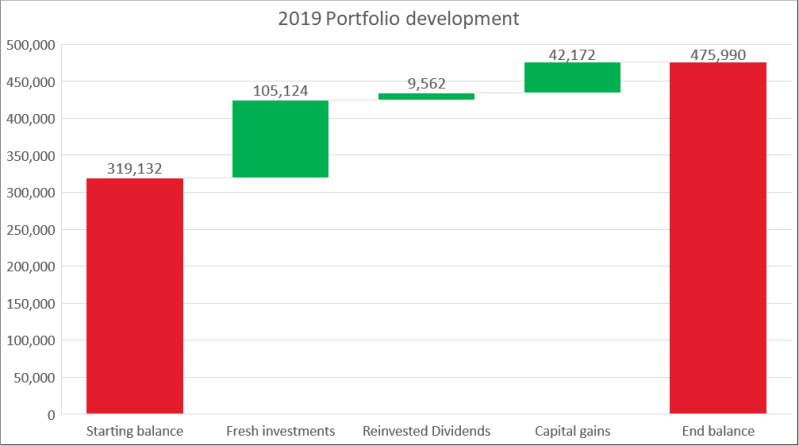
As usual I created a waterfall chart to celebrate the end of the year.
In 2019 my portfolio grew from SGD 319,132 by SGD 156,858 to SGD 475,990. Capital gains of SGD 42,172 and SGD 9,562 in sweet, tax free dividends contributed.
A successful year.
Investment vs. goal
At the beginning of 2019 I had decided to save up SGD 100,000 during the year. Am very glad to report that this time I exceeded this goal and managed to save up and invest SGD 114,686.
I am glad I did not succumb to lifestyle inflation too much and managed to save more money as my income increased.
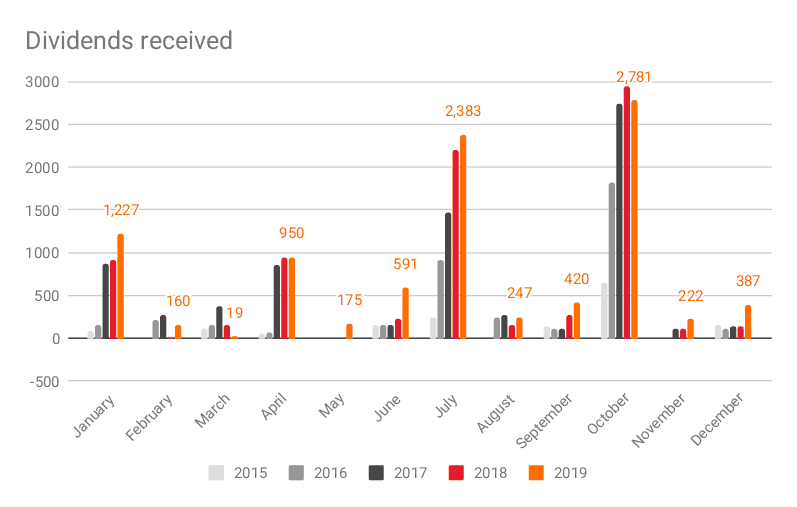
Dividends received
Despite the fact that quite a large part of my portfolio is in accumulating ETFs (to optimize tax), I still received quite some dividends from my Singaporean holdings. SGD 9,562 – nice.
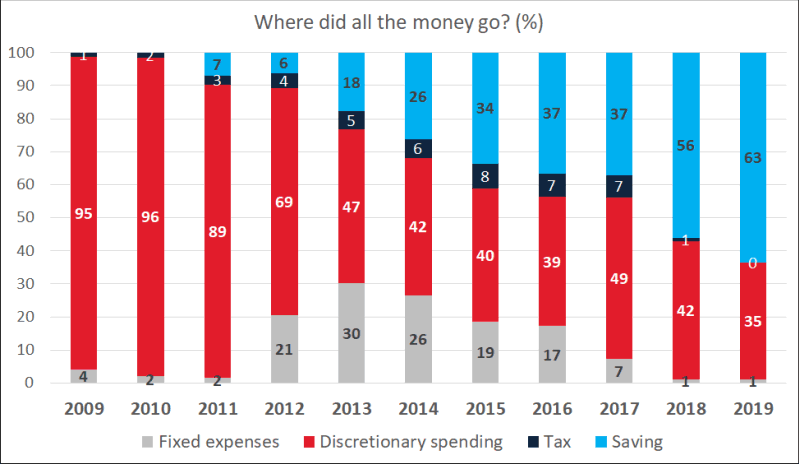
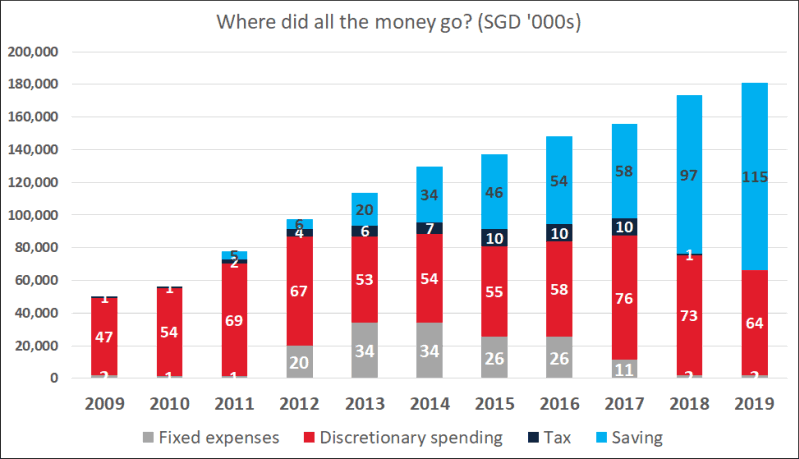
Where did all the money go?
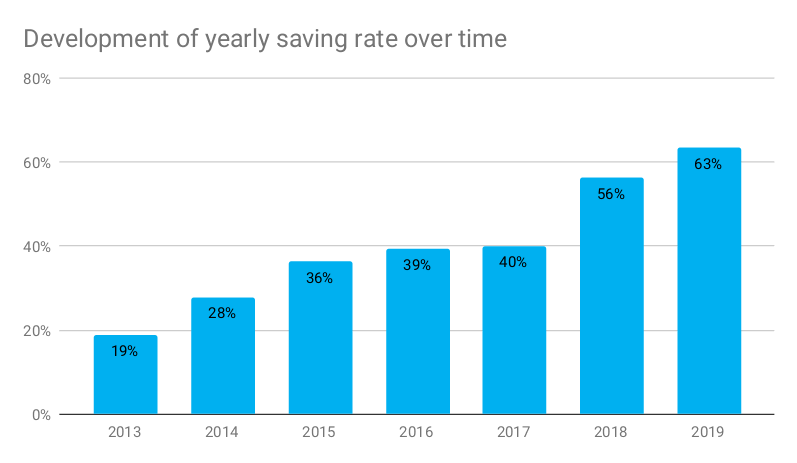
These charts are my favorite ones… For years I have been tracking my finances, but 2019 finally saw some improvement. The saving rate increased from 56% to 63%. My income increased and I also managed to spend less in absolute terms.
In relative terms the picture looks very positive, and fortunately in absolute terms discretionary spending has also been reduced, even though it still needs to come down furter to match the level of my Singapore days.
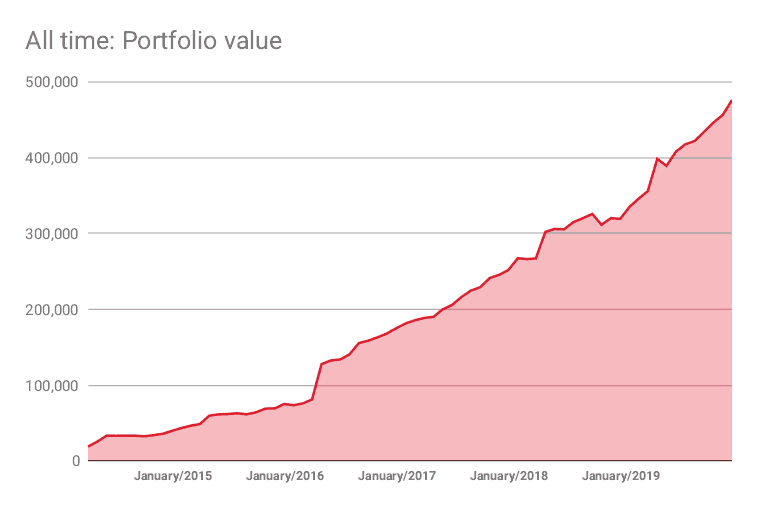
Development of saving rate over time:
As shown in the chart above, the saving rate increased nicely over the years.
Tracking a whole year of spending money
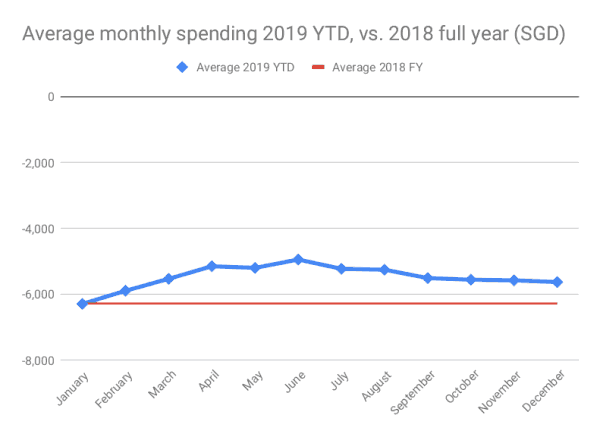
Last December I had announced my goal to track spending money for a whole year. I am glad I managed! It was quite a hassle, but I am glad I did it. Here is the result:
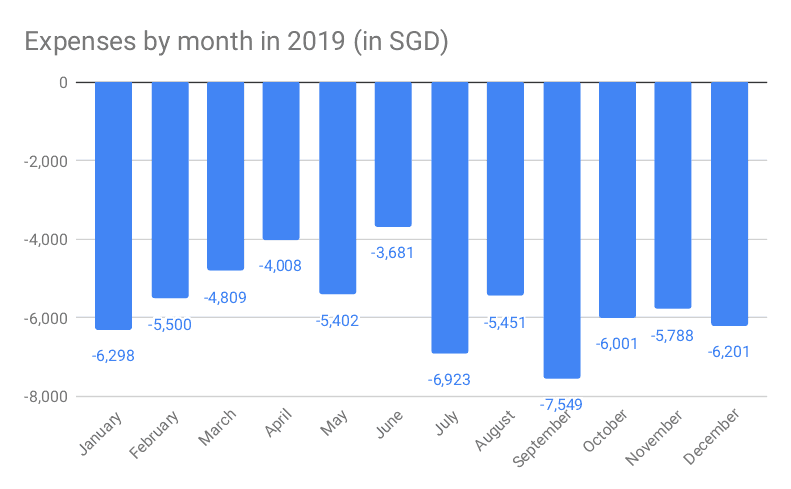 2019: Yearly spending by category
Monthly spending varied greatly. Best months were June and April, where I was rather disciplined.
| Category | EUR | SGD | USD | % of total expenses |
| Travel | -12,458 | -18,852 | -13,184 | 28% |
| Other | -5,351 | -8,120 | -5,614 | 12% |
| Eating out | -4,688 | -7,118 | -5,112 | 11% |
| Car | -4,322 | -6,560 | -4,680 | 10% |
| Gifts | -3,158 | -4,783 | -3,408 | 7% |
| Groceries | -2,914 | -4,424 | -3,187 | 7% |
| Utilities | -2,513 | -3,807 | -2,639 | 6% |
| Business | -2,278 | -3,457 | -2,472 | 5% |
| Bars | -1,634 | -2,482 | -1,785 | 4% |
| Cleaning & Ironing | -1,519 | -2,302 | -1,642 | 3% |
| Uber | -1,441 | -2,187 | -1,594 | 3% |
| Eyes, Hair, Health | -1,116 | -1,691 | -1,231 | 3% |
| Canteen | -718 | -1,091 | -769 | 2% |
| Entertainment | -295 | -447 | -317 | 1% |
| Total | -44,404 | -67,363 | -46,613 |
(The figure does not precisely tally with the one from the charts above, this is because of the exchange rate fluctuations. Still: close enough!)
Notable points:
- I spent a crazy amount on travel for my wife and myself. The amount is quite mind boggling. 28% of my total expenses!
- Still on the bright side I spent less money than last year.
Outlook 2020
Will soon plan my goals for 2020, but one thing is clear: money is more or less on autopilot and will lead to early retirement at some point. I have to focus on relationships, health and exercise and becoming a better person.
As far as financial markets are concerned, I would not be surprised if there was a major downturn event in 2020. What do you think?
Happy for you. You inspire me.
Nice~!
I just started my journey, like 2 years into the investment world, still a lot to learn, this post give me some idea on how to track my saving and expenses.